Wed, Sep 11, 2019
Includes New VFR Flyway Charts
Steer clear of Bravo airspace and commercial traffic with new VFR planning charts included with the latest release of ForeFlight ... Version 11.7.
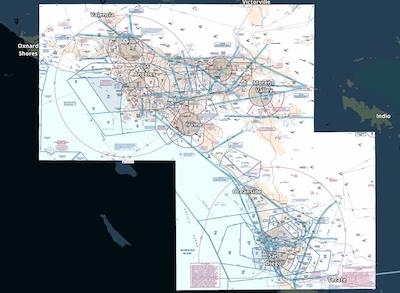
Download and view the FAA's newly georeferenced VFR Flyway Charts directly on ForeFlight’s map for improved VFR flight planning in big cities. The charts depict potential VFR routes through and around 19 major U.S. metropolitan areas, helping you circumvent Class B airspace and high-traffic areas and providing increased visual awareness.
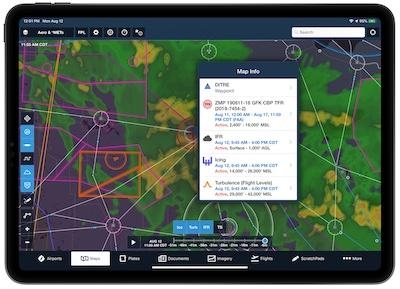
The new version also includes a number of improvements allow users to do more with map layers and the single-tap gesture. Enable multiple shape-based map layers like TFRs and AIR/SIGMET/CWAs simultaneously, then tap where they overlap to select which one you want to view information about. This multi-layer “Map Info” popup also allows you to select elements from other map layers like winds aloft barbs, PIREPS, lightning, obstacles, and Aeronautical Map elements like waypoints and airways. Users can also now tap on FBO markers that are built into ForeFlight’s Aeronautical Map airport diagrams to quickly access information about them.
Additionally, users can share aircraft profiles in ForeFlight with other pilots for easy collaboration when flight planning. Tap the Send To button while viewing an aircraft to share it via Airdrop, email, text, or any other messaging app. The recipient can then tap the link on their iPad or iPhone to accept the share. Shared aircraft are read-only, so recipients can't change any of the aircraft's details, but any changes made by the original owner are automatically synced to any recipients.
Recipients must be running ForeFlight version 11.7 or above to accept shared aircraft. Aircraft shared from a Performance Plus account to a non-Performance account will not include the ForeFlight Performance Profiles, as these are only available with Performance Plus.
ForeFlight customers in Europe can now view graphical enroute NOTAMs as part of the NOTAMs/TFRs map layer. ForeFlight uses geographic data contained in NOTAM descriptions to draw their actual shapes whenever possible, and color-codes NOTAMs gray, orange, or red based on increasing severity and type. Tap on each NOTAM to view its description and active times.
(Source: ForeFlight. Images provided)
More News
Also: Vertical Flight Society, NBAA Maintenance Conference, GA Honored, AMT Scholarship For the first time, students from Embry-Riddle’s Daytona Beach, Florida, campus took t>[...]
Hazardous Weather Information Summary of significant meteorological information (SIGMET/WS), convective significant meteorological information (convective SIGMET/WST), urgent pilot>[...]
"The need for innovation at speed and scale is greater than ever. The X-62A VISTA is a crucial platform in our efforts to develop, test and integrate AI, as well as to establish AI>[...]
(FAA) Inspector Observed That Both Fuel Tanks Were Intact And That Only A Minimal Amount Of Fuel Remained In Each Analysis: According to the pilot, approximately 8 miles from the d>[...]
“Pyka’s Pelican Cargo is unlike any other UAS solution on the market for contested logistics. We assessed a number of leading capabilities and concluded that the Pelica>[...]
 Airborne-Flight Training 05.09.24: ERAU at AIAA, LIFT Diamond Buy, Epic A&P