Ancillary Fees Continue To Be A Major Revenue Center For
Carriers Large And Small
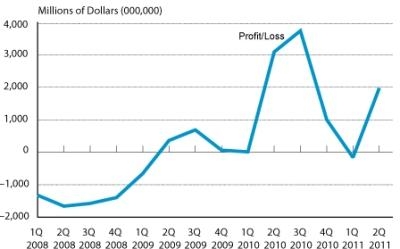
Scheduled passenger airlines reported a profit margin of 5.1
percent in the second quarter of 2011, up from the 0.5 percent loss
margin in the first quarter but a smaller profit margin than the
9.0 percent margin during the second quarter of 2010, according to
a report of preliminary data released Monday by the DOT's Bureau of
Transportation Statistics (BTS).
BTS Graph
BTS, a part of the Research and Innovative Technology
Administration, reported that the network airlines reported an
operating profit margin of 5.5 percent as a group in the
April-to-June period. The low-cost group's profit margin was 4.2
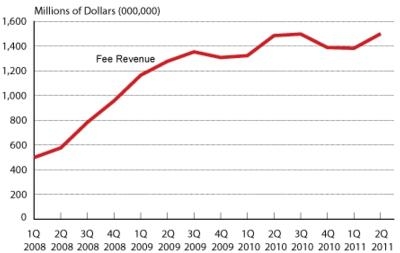
percent. As part of their second-quarter revenue, the airlines
collected $887 million in baggage fees and $612 million from
reservation change fees from April to June.
In addition to baggage and reservation change fees, airlines
reported ancillary revenue of $709 million from passengers and from
other sources. This revenue category includes revenue from frequent
flyer award program mileage sales and pet transportation fees.
Total second quarter 2011 airline revenue from all ancillary
sources that can be identified, including fees and frequent flyer
sales was $2.208 billion, with Delta Air Lines reporting the most,
$691 million.
Baggage fees and reservation change fees are the only ancillary
fees paid by passengers that are reported to BTS as separate items.
Other fees, such as revenue from seating assignments and on-board
sales of food, beverages, pillows, blankets, and entertainment are
reported in a different category with other items and cannot be
identified separately.
BTS Graph
The combined baggage and reservation change fees from passengers
combined with ancillary revenue from other sources constituted 5.5
percent of the total revenue of the 28 carriers that reported
receiving ancillary revenue. Spirit Airlines reported the largest
percent of operating revenue from ancillary revenue of any carrier,
29.7 percent.
The six network carriers posted a profit margin of 5.5 percent
in the second quarter with a combined operating profit of $1.6
billion. In the second quarter of 2010, the network carriers
reported a profit margin of 9.0 percent with a profit of $2.4
billion. The seven low-cost carriers reported a 4.2 percent profit
margin, with profits of $283 million for the 11th consecutive
profitable quarter. The seven regional airlines reported a 2.5
percent profit margin that included profits of $49 million.
Operating margin measures profit or loss as a percentage of the
airline’s total operating revenue. The top three operating
profit margins of the three carrier groups were reported by network
carriers Alaska Airlines and Continental and low-cost carrier
Spirit Airlines. Horizon Airlines reported the top loss margin of
any carrier.

Network carriers operate a significant portion of their flights
using at least one hub where connections are made for flights on a
spoke system. Low-cost carriers are those that the industry
recognizes as operating under a low-cost business model, with lower
infrastructure and aircraft operating costs and with less reliance
on the hub-and-spoke system. Regional carriers provide service from
small cities, using primarily regional jets to support the network
carriers’ hub and spoke systems. The selected network,
low-cost and regional groups consist of those airlines in each
group with the highest reported operating revenue in the most
recent complete calendar year.
 ANN's Daily Aero-Term (04.25.24): Airport Rotating Beacon