Warmest Year Since 1880, According To NASA
Earth’s global surface temperatures in 2017 ranked as the second warmest since 1880, according to an analysis by NASA.
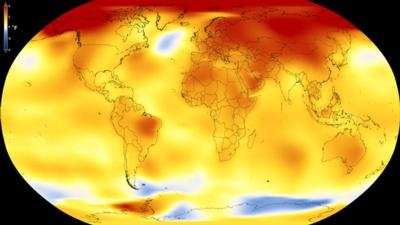
Continuing the planet's long-term warming trend, globally averaged temperatures in 2017 were 1.62 degrees Fahrenheit (0.90 degrees Celsius) warmer than the 1951 to 1980 mean, according to scientists at NASA’s Goddard Institute for Space Studies (GISS) in New York. That is second only to global temperatures in 2016.
In a separate, independent analysis, scientists at the National Oceanic and Atmospheric Administration (NOAA) concluded that 2017 was the third-warmest year in their record. The minor difference in rankings is due to the different methods used by the two agencies to analyze global temperatures, although over the long-term the agencies’ records remain in strong agreement. Both analyses show that the five warmest years on record all have taken place since 2010.
Because weather station locations and measurement practices change over time, there are uncertainties in the interpretation of specific year-to-year global mean temperature differences. Taking this into account, NASA estimates that 2017’s global mean change is accurate to within 0.1 degree Fahrenheit, with a 95 percent certainty level.
“Despite colder than average temperatures in any one part of the world, temperatures over the planet as a whole continue the rapid warming trend we’ve seen over the last 40 years,” said GISS Director Gavin Schmidt.
The planet’s average surface temperature has risen about 2 degrees Fahrenheit (a little more than 1 degree Celsius) during the last century or so, a change driven largely by increased carbon dioxide and other human-made emissions into the atmosphere. Last year was the third consecutive year in which global temperatures were more than 1.8 degrees Fahrenheit (1 degree Celsius) above late nineteenth-century levels.
Phenomena such as El Niño or La Niña, which warm or cool the upper tropical Pacific Ocean and cause corresponding variations in global wind and weather patterns, contribute to short-term variations in global average temperature. A warming El Niño event was in effect for most of 2015 and the first third of 2016. Even without an El Niño event – and with a La Niña starting in the later months of 2017 – last year’s temperatures ranked between 2015 and 2016 in NASA’s records.
In an analysis where the effects of the recent El Niño and La Niña patterns were statistically removed from the record, 2017 would have been the warmest year on record.
Weather dynamics often affect regional temperatures, so not every region on Earth experienced similar amounts of warming. NOAA found the 2017 annual mean temperature for the contiguous 48 United States was the third warmest on record.
Warming trends are strongest in the Arctic regions, where 2017 saw the continued loss of sea ice.
NASA’s temperature analyses incorporate surface temperature measurements from 6,300 weather stations, ship- and buoy-based observations of sea surface temperatures, and temperature measurements from Antarctic research stations.
These raw measurements are analyzed using an algorithm that considers the varied spacing of temperature stations around the globe and urban heating effects that could skew the conclusions. These calculations produce the global average temperature deviations from the baseline period of 1951 to 1980.
NOAA scientists used much of the same raw temperature data, but with a different baseline period, and different methods to analyze Earth’s polar regions and global temperatures.
(Image provided with NASA news release)
 ANN's Daily Aero-Term (04.28.24): Airport Marking Aids