Low-Cost Carriers Double Share In Less Than A Decade
The world's airlines have scheduled 4% more capacity on 2.5%
more flights in November 2011, marking six consecutive months of
growth compared to the same period last year, according to the
latest statistics from OAG. The OAG FACTS (Frequency and Capacity
Trend Statistics) report for November reveals that 59,639 more
scheduled flights offering 11 million more seats will operate this
month, totaling 312.7 million seats on 2.4 million flights.
Capacity growth continues to be driven by 'next-generation'
aircraft, such as Boeing's 747-8 Intercontinental and Airbus' A380
jetliner, which carry more passengers than the older models that
are being replaced. Average seats per flight in November total 126,
compared to 125 a year ago.

Regionally, Asia Pacific remains the largest aviation market
overall, with 35.6% share of worldwide seat capacity. The
intra-Asia Pacific region also retains its leading position in
total seat volumes, growing 8% to nearly 96 million seats in
November 2011 compared to November 2010, comprising 30.6% of the
worldwide seat share. Intra-North America is the second-highest
seat volume region, at 23%, but recorded a decline of 2.1% versus
the year-ago period. 'To/From Africa,' 'Within North America,' and
'Within Europe' all registered a decline in frequency of 6.0%,
2.7%, and 0.6% respectively compared to the same period last
year.
"Economic instability and political unrest have begun to hamper
both business and leisure travel demand in the U.S., Europe and
Africa, and we expect to see ongoing declines in seat and frequency
growth rates in these regions compared to the worldwide average,"
said Peter von Moltke, Chief Executive Officer, UBM Aviation. "That
said, we are witnessing history in Asia, where an incremental 2.9
million seats were added by just 6 airports year-over-year in
November. The possible impact of an economic crisis aside, the
increasing travel demand to, from and within Asia Pacific and other
developing countries will sustain the industry's overall growth for
a long time to come."

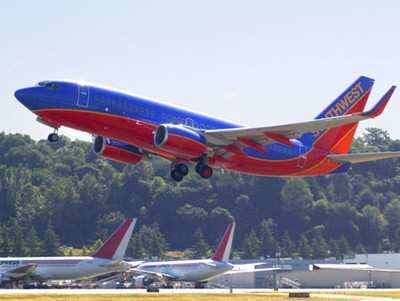
In November 2011, Low Cost Carriers have a worldwide schedule
capacity share of 24% -- a marginal 1% improvement over the
previous year, driven by slowing growth in Europe and North
America. However, LCCs' worldwide share of capacity and frequency
has more than doubled in less than a decade, growing from 10%
capacity share in November 2002 to 24% in November 2011, and 8%
frequency share in Nov. 2002 to 20% this month. The Middle East,
Central & South America, and Asia Pacific continue to lead LCC
seat capacity growth, posting 20%, 18.5% and 17.1% increases
respectively over November 2010.
The world's busiest airport (by passenger traffic), Atlanta, saw
a 3% decline in schedule frequency and 1% decline in seat capacity.
Beijing, second in passenger traffic volume, is catching up with 1%
and 3% growth in schedule frequency and seat capacity respectively.
London Heathrow remains the third-busiest passenger airport in the
world, recording a marginal decrease in schedule frequency but a
marginal increase in seat capacity.
Based on annual growth rate of seat capacity among the world's
key hub airports in November 2011, Tirana (TIA) once again recorded
the highest growth rate of 65%, followed by Mexico City (38%) and
Tallinn (37%). Tripoli suffered the biggest decline in seat
capacity, 93%, compared to the same period last year, as well as
the highest decline in schedule frequency.
In terms of schedule frequency, Tirana Airport achieved the
highest growth rate of 57% over November 2010, followed by
Montevideo (50%) and Islamabad (45%).
 ANN's Daily Aero-Linx (04.15.24)
 Classic Aero-TV: 'No Other Options' -- The Israeli Air Force's Danny Shapira
 Aero-News: Quote of the Day (04.15.24)
 Airborne 04.16.24: RV Update, Affordable Flying Expo, Diamond Lil
 ANN's Daily Aero-Term (04.16.24): Chart Supplement US


